
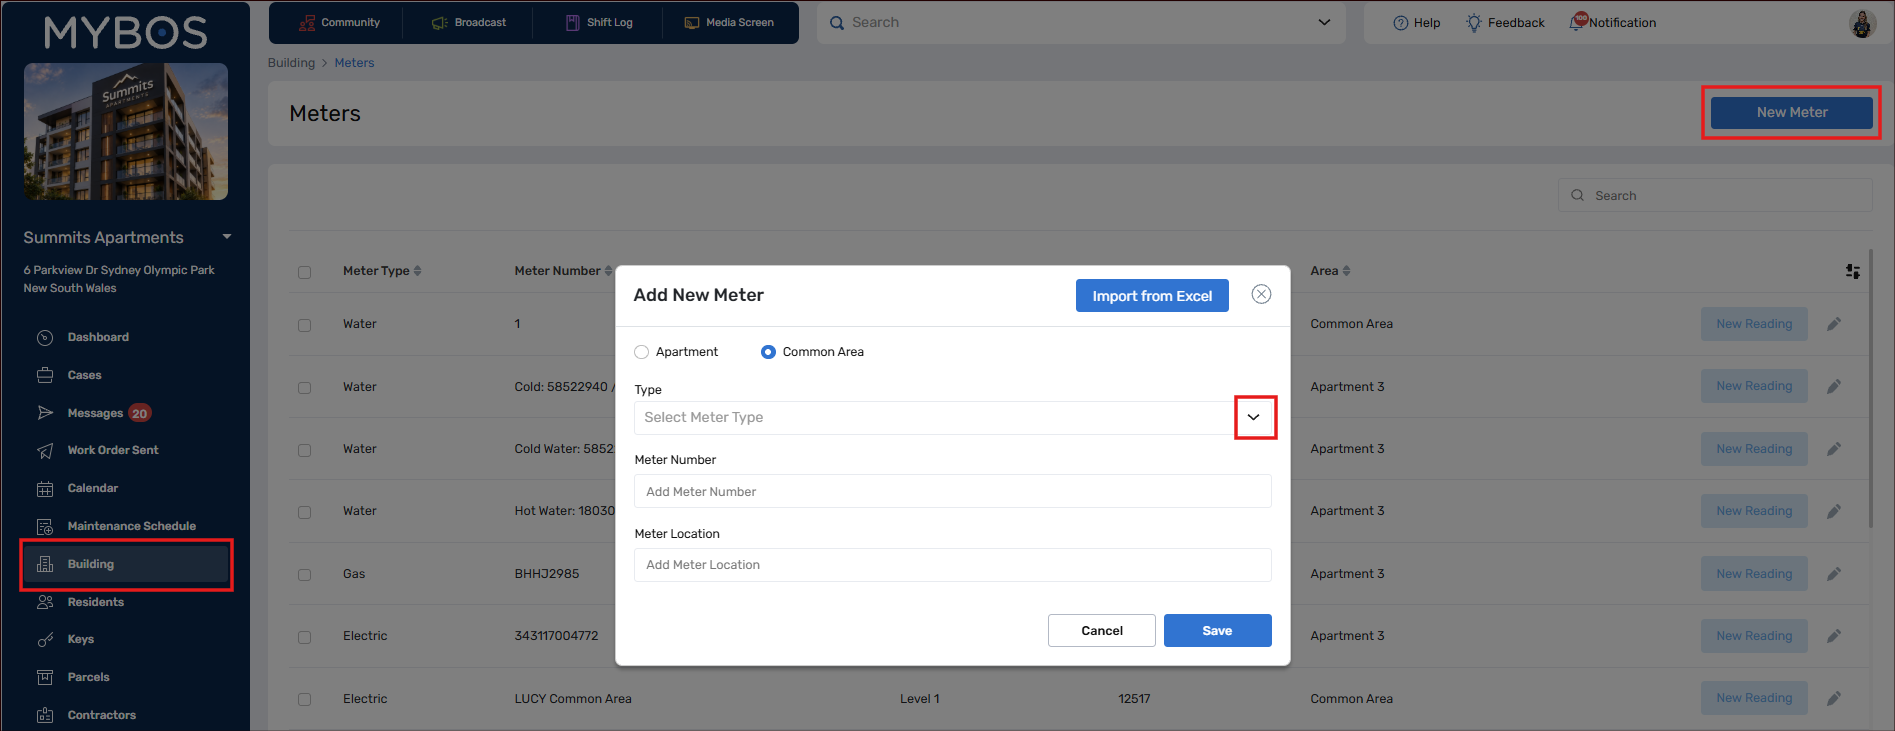
To access this area, open your Manager Web Portal and click on Building ➔ Meters.
The page lists every meter in the building with these columns:
|
Name |
What it shows |
|---|---|
|
Meter Type |
Gas, Electric or Water |
|
Meter Number |
The number or name of the meter |
|
Location |
Where the meter is, such as Level 1 or Pool Room |
|
Last Reading |
The most recent reading recorded |
|
Area |
The apartment the meter belongs to, or Common Area |
Use Search to find a meter, and click the meter number to open its readings.
Adding a Meter
Step 1: Go to Building ➔ Meters and click New Meter.
Step 2: Choose whether the meter is for an Apartment or the Common Area. If you choose Apartment, select the apartment.
Step 3: Choose the meter Type: Gas, Electric or Water.
Step 4: Enter the Meter Number and the Meter Location.
Step 5: Click Save.
Bulk Adding Meters
Step 1: Click on New Meter, then Import from Excel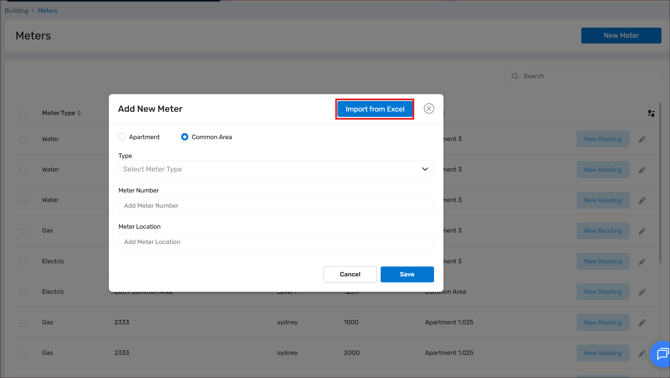
Step 2: In the pop up screen, select Download Template - fill this in with your meters.
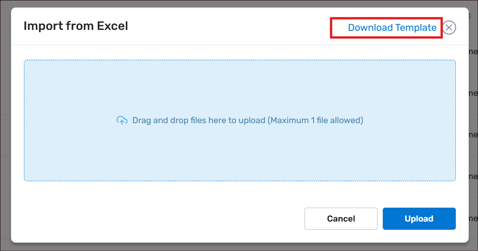 Step 3: Upload the completed file.
Record a Reading
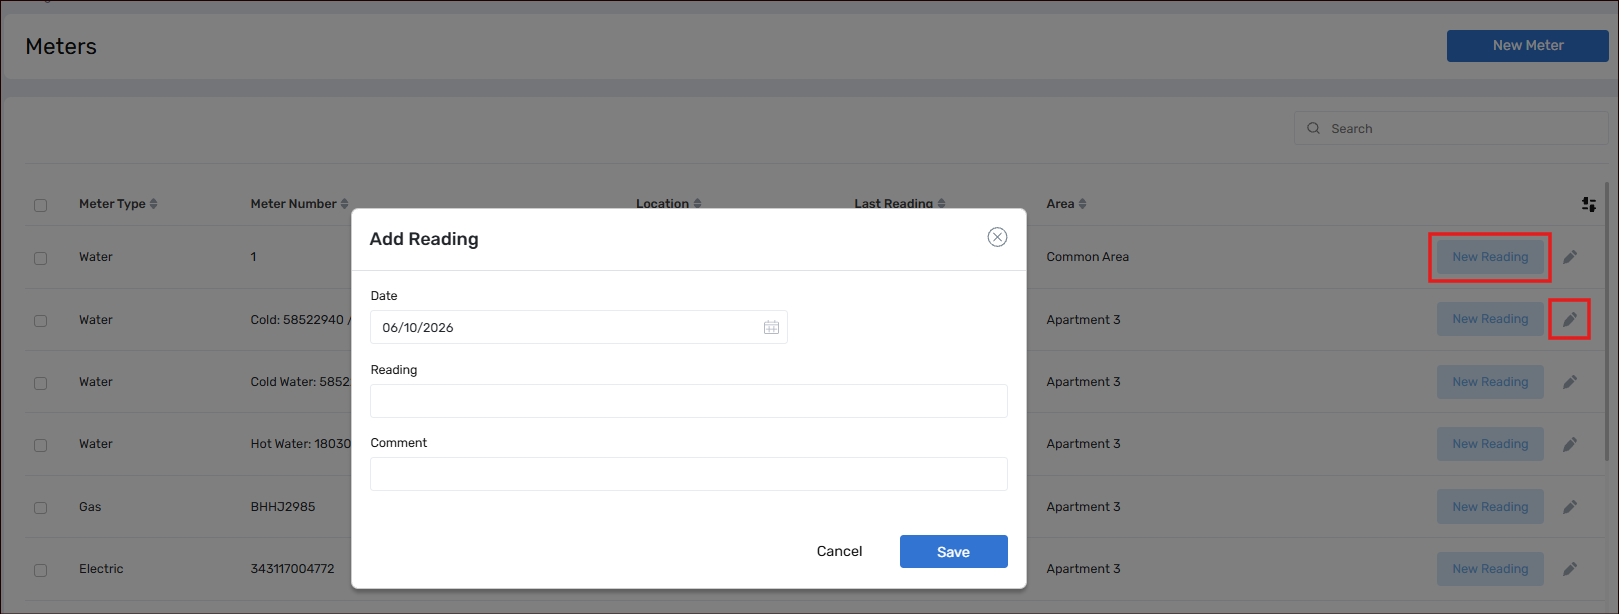
Step 1: On the Meters page, click New Reading beside the meter. You can also open the meter and click New Reading there.
Step 2: Check the Date, which defaults to today, or change it to the day the meter was read.
Step 3: Enter the Reading, and add a Comment if you need one.
Step 4: Click Save.
View readings and usage
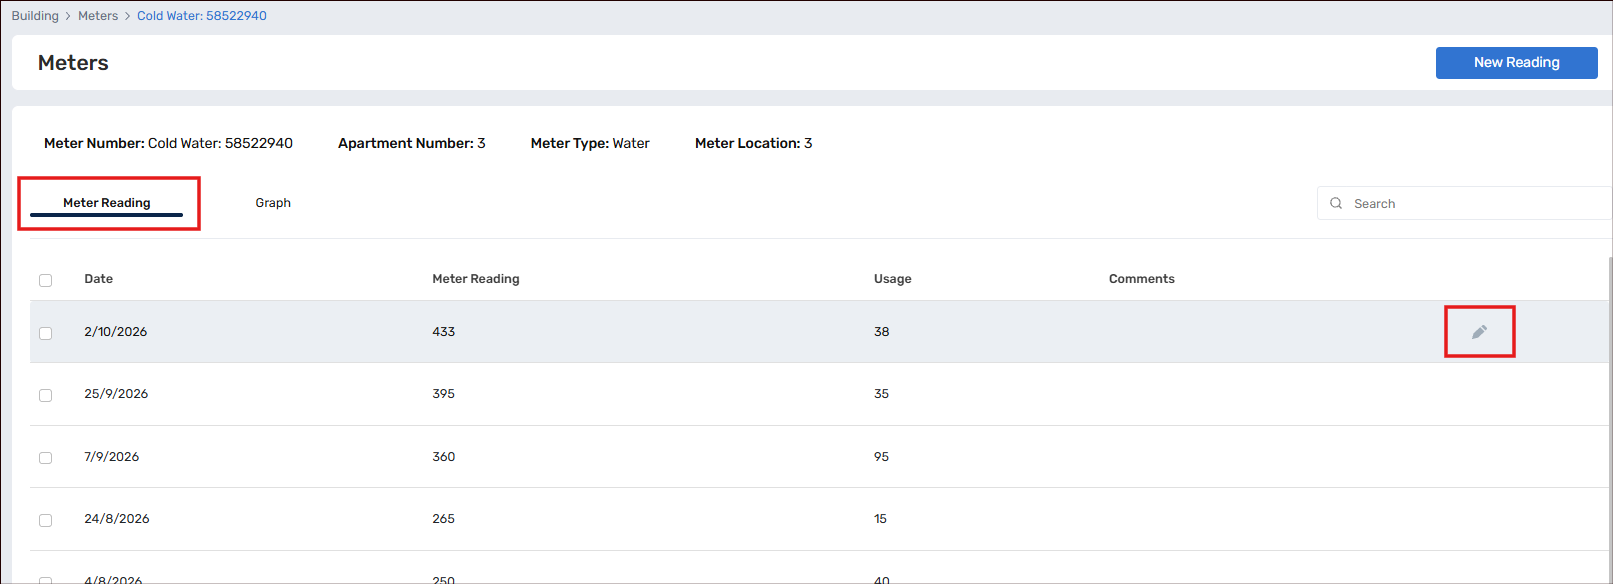
Click a meter to open it. The Meter Reading tab lists each reading with its date, the meter reading, the Usage since the previous reading, and any comments. Click the pencil icon at the end of a row to edit a reading. A meter's first reading shows its full value as usage, because there is nothing earlier to compare it with.
See consumption on a graph
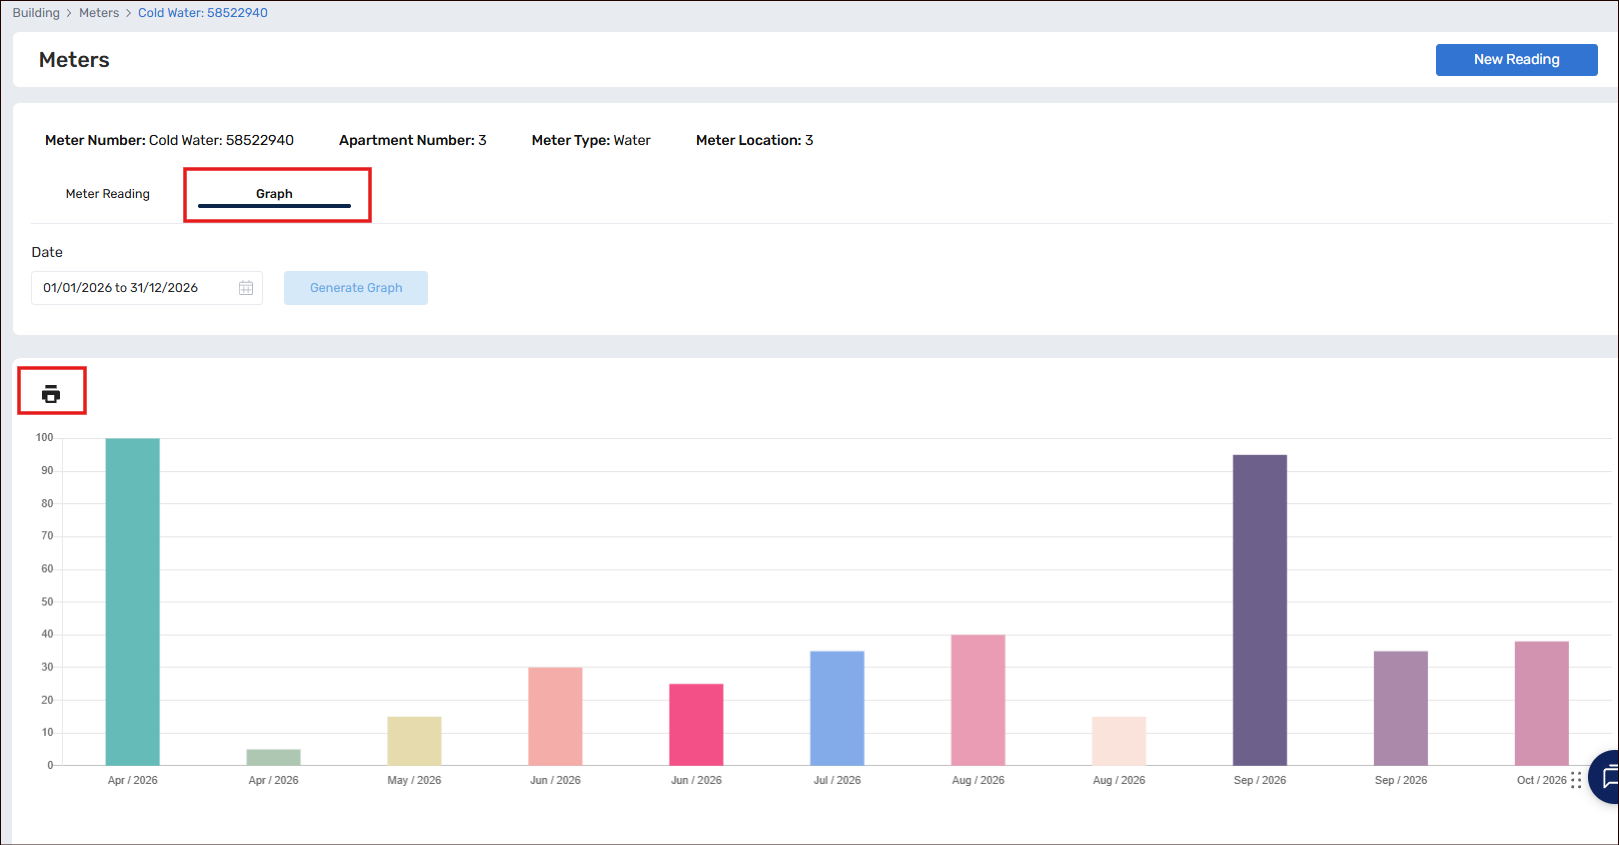
Step 1: Open the meter and select the Graph tab.
Step 2: Choose a date range.
Step 3: Click Generate Graph.
The graph shows usage between readings as a bar chart. Click the printer icon above the graph to print it.
Export or remove readings
On the Meter Reading tab, tick one or more readings. Icons appear beside the tabs to export the selected readings to Excel or delete them.
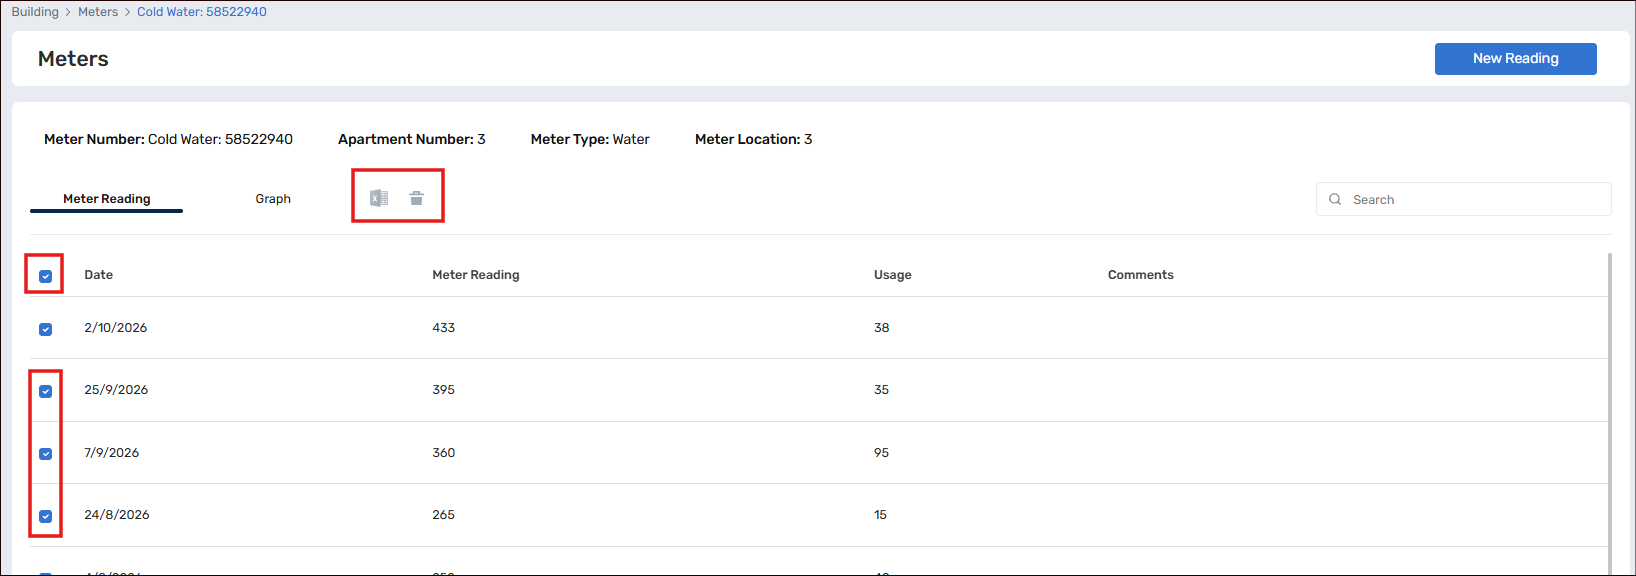
❗ Deleting is permanent and cannot be undone.
Tips and FAQs
What types of meter can I add? Gas, Electric and Water.
Can I track meters for common areas as well as apartments? Yes. When you add a meter, choose Apartment or Common Area.
How is usage calculated? Usage is the difference between a reading and the one before it. For example, readings of 150 and then 175 show a usage of 25.
What if I entered a reading wrongly? Open the meter and click the pencil icon beside the reading to correct it, or tick it and delete it.
Can I import my meters from a spreadsheet? Yes. Click New Meter, then Import from Excel, and use the template provided.
How do I keep my records reliable? Read each meter on a regular schedule, enter the date the reading was actually taken, and use the Comment field to note anything unusual, such as a meter replacement.
Video Walk Through

Managing Building Utility Meters 🏢 - Watch Video