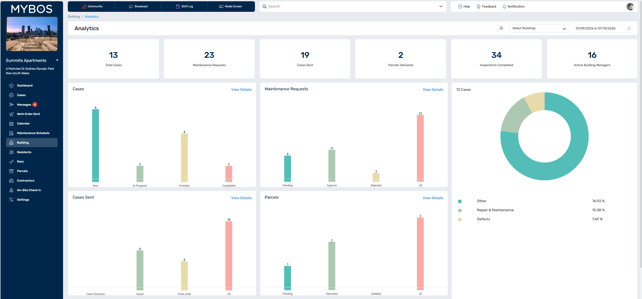
The Analytics section in MYBOS gives building and facility managers a clear view of operational activity across one or multiple buildings in one place. It helps users quickly understand what is happening by bringing together key data such as cases, maintenance requests, parcels, inspections, and other building activity.
How to View Your Building's Analytics
Step 1: Navigate to the Buildings section located on the left hand menu.
Step 2: Select Analytics to open the building analytics dashboard.
Step 3: From here, you will see a snapshot of all data across all buildings by default. To look at a specific building, click the Select Buildings dropbox and select your desired buildings.
Review the overview data, including cases, resident maintenance requests, parcels, inspections, and other building activity.
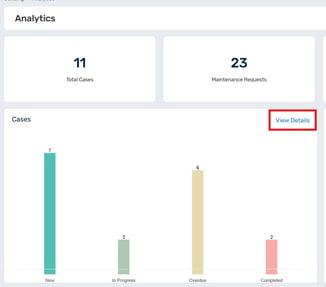
Step 4: You can click into any section to see a more detailed breakdown, such as work orders, quotes, or case summaries by clicking the View Details link in each module.
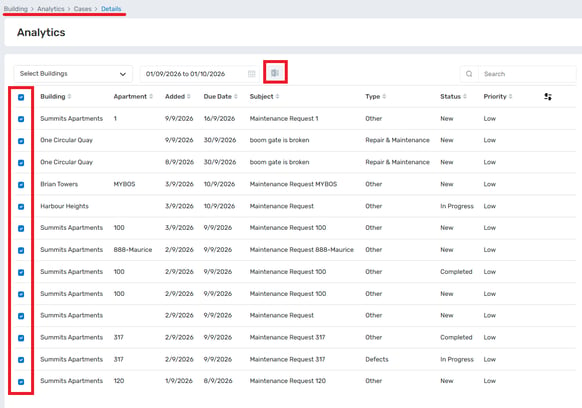
Step 5: Data across buildings can be exported to Excel by selecting all buildings and clicking the Excel button.
📔 For example, if a Building Manager wanted to see Maintenance Requests for all buildings and export that into excel, they would click View Details in the Maintenance Request module > Click View Details again > Select what they would like in the report > Click the Excel button.